Slide Tutorial - Part 2
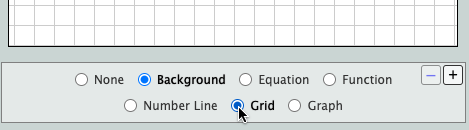
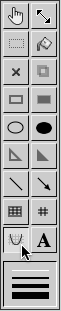 On the second slide, we'll create a grid on which to draw geometric figures. Click on the Graph Tool in the toolbar as shown. This opens up the graph menu directly below the slide. The menu gives a variety of options for setting a background to the slide. If you turn on the background (by clicking Background), you can choose between a number line, grid, or graph with x and y axis. You can also graph algebraic equations or trigonometric functions using the Equation and Function options. For now, simply click on Background and Grid to fill the slide with horizontal and vertical lines.
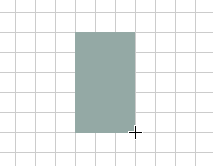
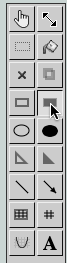 To draw a figure on the slide using the filled rectangle tool select the tool as shown. The figures you draw will be easier to see if they are a different color. Look for the palette at the top right of the slide
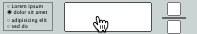
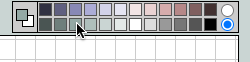 To make the rectangles green click on a green color in the palette. Notice that in the gray area on the right side of the palette there are two circles. Try clicking on each of the circles to see how it changes the palette. The top circle gives more color choices while the bottom circle gives a simpler selection of colors. Most users will find that the bottom palette is easier to use and results in more attractive slides since the colors are chosen to be complementary with the website's own design.
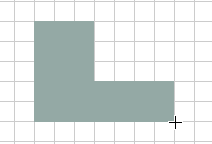
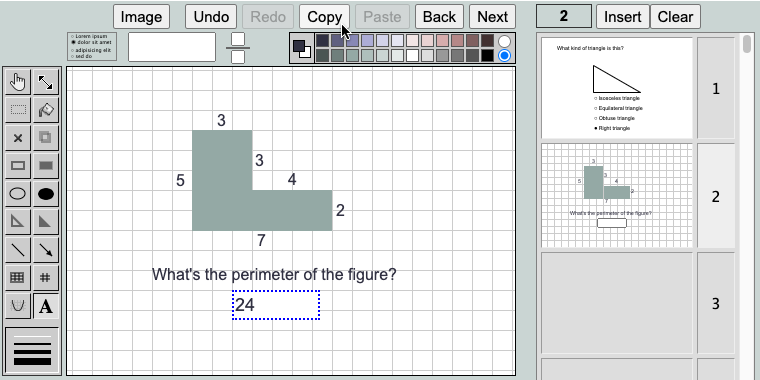
 Using the fill rectangle tool, draw two rectangles to form the figure. Use the grid to make the dimensions of your figure precise. The figure shown was formed with a 3x5 rectangle and a 2x4 rectangle.
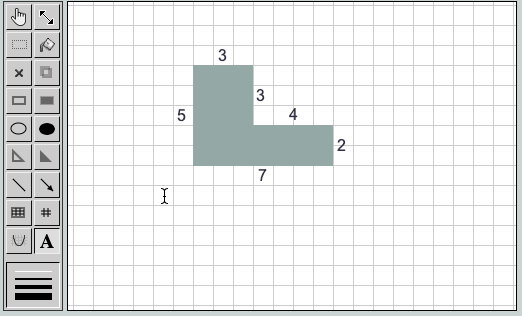 Using the text tool (A) label the edges of the figure. Simply click on the slide wherever you would like to place the labels, and use the keyboard to enter the numbers. All text is edited inside the special box which appears to the right of the slide. If you need to change a label, you can always click on existing text to edit it. In the example shown, the foreground color was set to black before adding the labels. The labels can be any color you choose.
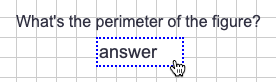
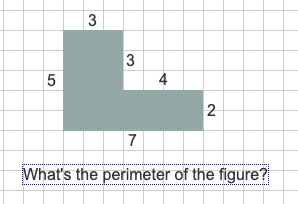 Using the same text tool write a question about the perimeter below the figure. Next, look for the empty answer boxes located above the slide. Click on an answer box and drag it onto the slide below the question.
Replace the default "answer" text in the box with the correct answer to the perimeter question. In the example the perimeter is 24. Now suppose that you want to create a similar slide which asks the area of the same figure. Instead of drawing the entire slide over again you can copy the work you've done here, paste it into a new slide, and make some small changes. Look for and click the Copy button.


Use the Next button to advance to an empty slide and then click Paste.
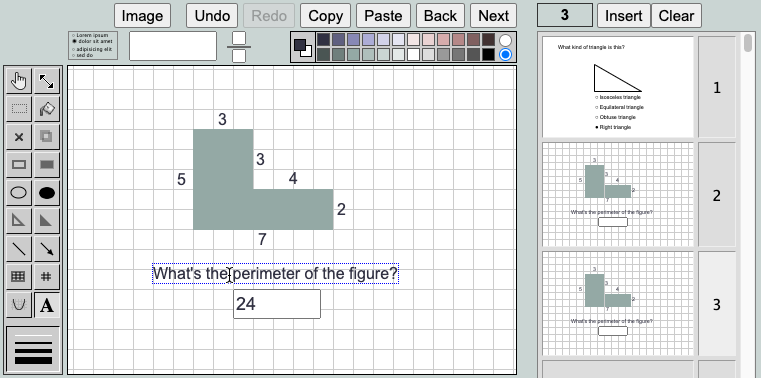 Now use the text tool to edit the perimeter question. When you hover over an object with a tool, the blue outline shows that it is ready to be edited. Notice that on the right side of the screen you can see an index of the three slides you've created. Currently, slide number three is selected.
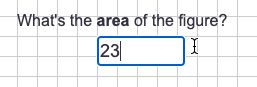
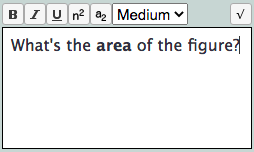 Let's edit the slide so that it asks for the area of the figure instead of the perimeter. Click on the perimeter question text. Select the word "perimeter" and replace it with the word "area". Select "area" and make the word bold by clicking on the B button. Next enter the correct area of the figure in the answer box. In the example the area is 23.
Click the Next button to move to the next slide, and go to the third part of this tutorial.